


Gold prices are breaking down, as the trend higher has been dismantled by the Federal Reserve who is poised to raise interest rates

Gold prices are breaking down, as the trend higher has been dismantled by the Federal Reserve who is poised to raise interest rates. Better than expected economic data including the February U.S. employment report, has provided the backdrop for a Fed rate hike on March 15. Not only are Fed fund futures pricing in a 95% chance that the Fed will increase rates, but 10-year yields have moved out and are currently printing at 2.61% the highest level of 2017.
ADVERTISEMENT
Gold trading is quoted in U.S. dollars, which means that it becomes more expensive to purchase gold in currencies other than the U.S. dollar when the value of the greenback rises. When yields in the U.S. rise relative to other countries, the dollar becomes a more attractive asset which paves the way for lower gold prices.
The Fed’s Dot Plots are Key
The Fed will play a role in the next move in gold prices. Traders await the Fed’s dot plots which describe their forecasts of future interest rate changes. Presently, traders have 2-rate hikes fully priced into the market, but the third, which is what the Fed expects, is not fully priced in. Commentary from the Fed could be the catalyst that provides a further increase in the probability of a 3rd rate hike. This in turn would increase the value of the dollar as well as weigh on gold prices.
The decline in gold prices were assisted by a liquidation by those who are long futures and options. According to the latest Commitment of Traders report released for the date ending March 7, 2017, managed money reduced long position in futures and options by 19.1K contracts, while increasing short position in futures and options by 8.6K contracts. Managed money that is long futures and options outnumber those who are short by 94K contracts, which could be the recipe for further long liquidation.
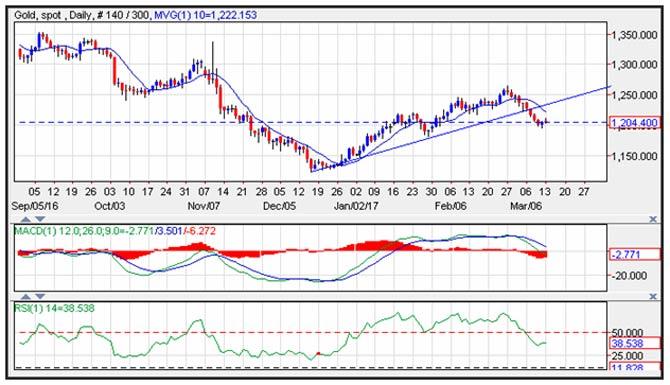
The technicals on gold prices continue to look bearish. Prices could be forming a heading and shoulder pattern as prices potentially attempt to rebound back to the 10-day moving average at 1,222, which coincides with an upward sloping trend line that comes in near 1,228. This type of pattern is a reversal pattern, which could test the December lows near 1,122, after a close below the January 26, lows at 1,180.
Momentum on Gold is Negative
Momentum on gold prices has turned negative as the MACD (moving average convergence divergence) index recently generated a crossover sell signal. This occurs as the spread (the 12-day moving average minus the 26-day moving average) cross below the 9-day moving average of the spread. The index moved from positive to negative territory which confirms the sell signal. The MACD index is printing in the red with a downward sloping trajectory which points to lower prices for the yellow metal.
The relative strength index (RSI) has stabilized after breaking down which reflects accelerating negative momentum. The RSI is a momentum oscillator and the current print of 38 is on the lower end of the neutral range.
 Subscribe today by clicking the link and stay updated with the latest news!" Click here!