


While the government and health officials might claim that India is flattening its curve, meet the experts looking into hard numbers and data predict a reality that is a lot grimmer

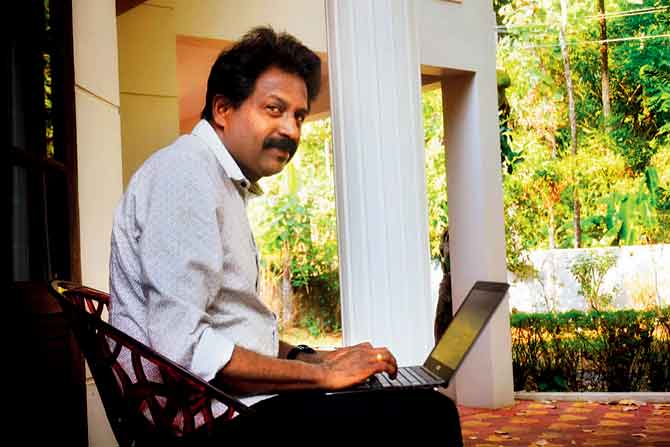
James Wilson says that the densely-populated slum pocket of Dharavi beat the virus, because of the extensive testing policy adopted by the BMC and the work of contact tracers. Pics/ Suresh Karkera and Bipin Kokate
BAD news is never welcome. Especially not when there is a glut of it already. For a world struggling to cope with everything from climate change to the Coronavirus pandemic, addressing the elephant in the room feels like a sinister attempt to snatch away the little stories we have for comfort. And yet, that's what drives us. In his new book, Bad News, American academic psychologist Robert Brotherton points out that bad news thrives, because "press corps have actively encouraged cynicism". "That necessarily entails seeking out wrongdoing, misconduct, failure, corruption, greed, cruelty, injustice, villains, and victims. In this light, being the bearer of bad news isn't a vice, but a virtue. It means you're doing your job right," he writes.
It's this cynicism coupled with curiosity that has led Trivandrum-based civil engineer and data analyst James Wilson to engage with COVID-19 data from across the world. Wilson says he has no agenda. He simply wants to understand the reality of where India stands in the fight against the virus. All through March and April, when the health infrastructure in Spain and Italy was crumbling, and India was being lauded for keeping COVID-19 cases under check, Wilson was advocating "testing and more testing" on his Twitter feed ( @jamewils). He even described the Indian Council for Medical Research's (ICMR) criteria of testing only symptomatic patients as "limited and rigid," and called it out for following the "don't test, don't find" approach. Four months on, having increased its testing capacity manifold, India is finally coming face to face with reality. With 10 lakh confirmed COVID-19 cases, it is now the third most-affected country in the world.
ADVERTISEMENT
Are we doing enough? If we go by Wilson's analysis of data sourced from ourworldindata.org, it's a "no". By July 14, India had completed 1.2 crore tests (exact number is 1,20,92,503). According to Wilson, this means we are now conducting 8.98 tests per 1,000 people of our population. Is this number high? To understand that, you'd have to compare it with the US (121.7), Russia (159.61), Canada (85.13) and Australia (118.49). The difference is both glaring and worrisome.
James Wilson's data projections are based entirely on his knowledge of mathematics and rich experience in data analysis
Wilson also predicts a massive rise in the number of cases by the end of this month. "India may have more than 15.5 lakh #COVID19 cases by July 31st and will cross 16 lakh cases on August 1st," he shared on Twitter, where his sharp and almost-accurate estimations have won him a following of nearly 50K.
Wilson admits, over a telephone interview with mid-day, that he is no epidemiologist. His projections are based solely on his "knowledge of mathematics and rich experience in data analysis". But he is among the handful of people in India, breaking down facts and numbers, and sometimes challenging and countering mainstream rhetoric with indisputable data.
Like Wilson, there is the volunteer-driven website, covid19india.org, which presents a "tracker" based on a database of up-to-date numbers, entered by its members. When India reported its first case of COVID-19 in Kerala on January 30, and two more by February 3—all were students returning from Wuhan in China—it was certain that the pandemic had arrived in the country. The dire need for reliable information on infection rate and recovery, saw a group of volunteers step in, to form covid19india.org in early March. The website aggregates data from every district in India. "Our country is notorious for fake news spreading through social media and instant messengers. Having systematic and structured information is always the catalyst for future decisions. Since the situation was unprecedented, nobody knew what to do in the beginning and only a few states had any sort of process to release COVID-19 related information," said a member of the team, requesting anonymity. "We wanted to make things clearer for concerned citizens. Collecting the data at a patient-level would enable researchers and analysts to understand the spread, the demographics and the risk factors. We decided to fill this gap of data collection and presentation," the member added. Around 122 million users have visited the website till date.
One person who sources her information from covid19india.org is Chennai-based data journalist Rukmini Shrinivasan whose mini-podcast series, The Moving Curve, which is already 83 episodes down, has been tackling important questions around the Coronavirus in India. "Back in March, none of us knew our lives were going to be consumed by the pandemic. I was looking at the numbers on various government websites from across the world out of curiosity. The information was all new, so, I began assimilating data into short takeaways for myself," says Shrinivasan. In the first episode, which aired on March 25, Shrinivasan discussed that "it took India 40 days to reach the first 50 cases, five more days to reach 100 cases, three more days to reach 150 cases and then just two more days to reach 200 cases". "From here on, the juggernaut is going to roll fast," she had said, not mincing her words.
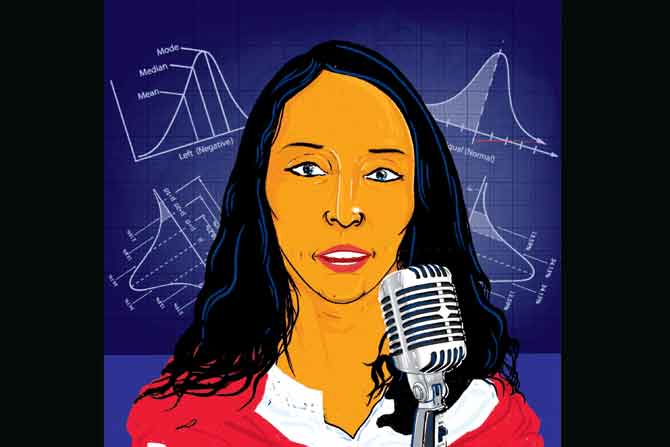
Rukmini Shrinivasan’s mini-podcast series, The Moving Curve, is 83 episodes down and has been tackling important questions around the Coronavirus in India. Illustration courtesy/Satwik Gade
Long before Wilson became known for his COVID-19 predictions, he was the expert voice on the impact of PM Narendra Modi's decision on demonetisation. Wilson spent a significant part of late 2016 and 2017, deciphering how the BJP government's move would affect the currency in circulation, and if it would really help flush out black money. His Twitter handle and blog, Decipher the Demonetisation, had become an important resource for many, and his fans included veteran journalist Shekhar Gupta, who claimed that Wilson had "the best data-mining track on #demonetisation flip-flops". His posts even caught the attention of the Reserve Bank of India.
Wilson, who has been with the Kerala State Electricity Board Limited for 26 years, developed an interest in data analysis, while working with a team of Canadian consultants, as part of an electricity board assignment. "I used to deal with a lot of data on project monitoring [for them]," he says. Later, when he was posted in the reservoir management cell of KSEBL, he was able to efficiently put to use the knowledge he acquired with the Canadian consultants. "I started working with data again, and developed my own techniques, based on intuition and research." Thereafter, in 2006, Wilson was moved to the Mullaperiyar special cell, where he was the lead resource person for the Kerala government, providing information on the water dispute, for the Supreme Court. He is currently enjoying a second stint in KSEBL as a member of the expert advisory group on reservoir management.
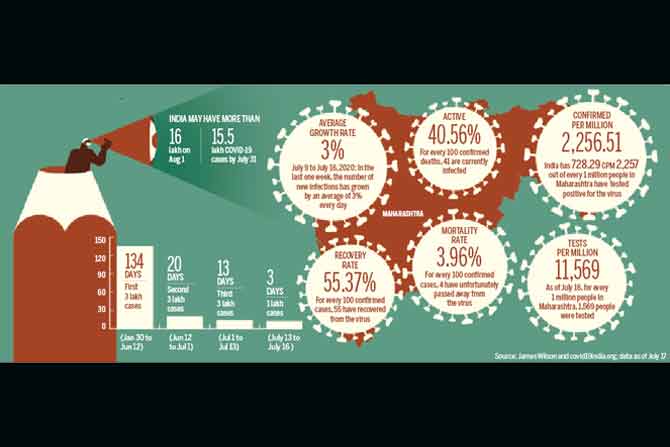
Source: James Wilson and covid19india.org; data as of July 17
Data crunching, hence, is second nature to Wilson. His interest in Coronavirus took root in February, after his home state, Kerala, reported the first three cases. No other state had raised an alarm during this time, despite India having strong business ties with China. Considering the growing number of cases in Wuhan, Wilson was wary of how prepared India was, in case of an outbreak. "I started reading articles including those in reputed science journals," he recalls. "I even read World Health Organisation reports on the virus, which specified the importance of testing."
When Kerala was hit by a second wave in the first week of March, Wilson started delving deeper. That the state had successfully nipped Nipah virus in the bud in 2018, made for an important case study. "I read about the steps we were taking, and the spreading pattern of the disease. Incidentally, the Kerala government was adopting the same strategy it used to tackle Nipah. But, while Nipah was deadlier—once you are infected, there are high chances of fatality—this virus wasn't as fatal, but spread rapidly," he shares.
What he found most problematic was the travel advisories being issued for international airports in India, which restricted thermal screening for passengers coming from China, and a handful of South East Asian states, when scientists from ICMR had cautioned that "thermal screening would not identify more than 50 per cent of the infected travellers, as they remain asymptomatic in the early stages of the infection". Wilson even wrote about it in his last blog post on jamewils.com, where he stated how India had failed "to screen all international travellers for many weeks in the initial phase" due to its flawed policy.
The lack of screening and testing facilities has been a sore point for Wilson, who has consistently pulled up state governments that had been falling short, forcing them to take stock of the situation.
On May 10, which was the 48th day of the lockdown, Wilson highlighted how the tests per case in Maharashtra was just 18 per case, well below the national average of 28 tests per case. "From the beginning till now, we have only been testing symptomatic patients. This approach is not foolproof," says Wilson, who collates his information from WHO, Johns Hopkins University and Our World in Data, an online scientific publication. "The problem is that we have a lot of people who are affected by the virus, but have developed immuno-resistance. And, we don't have their numbers yet. Around 95 per cent of our testing involves only those who have shown some symptoms of Coronavirus," he adds.
Wilson says that the densely-populated slum pocket of Dharavi beat the virus, because of extensive testing adopted by the BMC. "Asymptomatic patients are tested only in super-spread areas. Only when the numbers increase in a particular threshold, do they really isolate and test. Every single day that you delay the testing, you are allowing the virus to spread."
One of the most alarming observations made by Shrinivasan during this four-month period of lockdown was from the ICMR study conducted between January 22 and April 30. "The study shows that on average, only six contacts per person were being traced, not even tested. For over half of them, there are no real details on who was tested and why. In South Korea, the share of people whose contact details are traced is over 80 per cent. When I read this, it struck me that our basic system was falling apart."
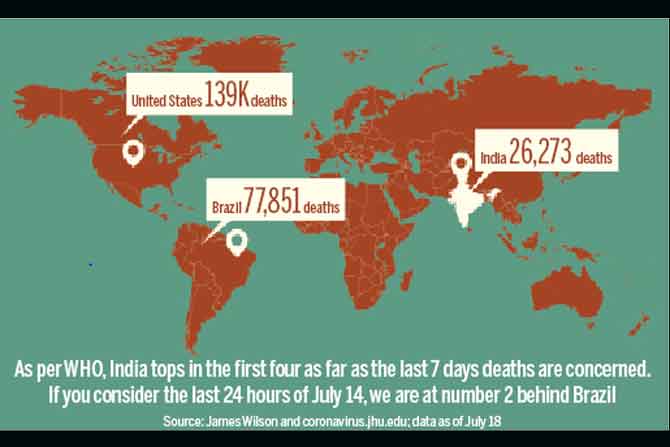
Source: James Wilson and coronavirus.jhu.edu; data as of July 18
She recommends using the London model to improve contact tracing. "In London, after people were out of jobs, the government hired employees of call centres to do contact tracing. What I don't understand is why our state governments are not offering money to hire short-term testing staff? We have fallen back majorly, and something needs to be done. Of all the states, Karnataka is trying to keep up with respect to contact tracing."
Another major challenge for the likes of Shrinivasan and Wilson, who rely on data, is the lack of accurate and reliable statistics on the novel Coronavirus in India.
Since May, there has been a mismatch in COVID-19 cases and deaths that have been reported by districts to the state government, and the final figures uploaded on the ICMR portal through CV Analytics.
On June 15, the BMC said that the city's COVID-19 death toll was 2,248, including the 58 new deaths, it had announced. By the next morning, the numbers had jumped by about 40 per cent. A similar story played out in Delhi and Chennai. These increases came about as a result of "death data reconciliation" exercises that at least three states—Maharashtra, Delhi and Tamil Nadu—had undertaken, in order to fix lags, misreporting and other errors in the reporting of COVID-19 deaths by hospitals and municipal corporations. But, none come close to Telangana, with respect to gross mismanagement of data, says Shrinivasan. "It is in the worst shape for terrible transparency of data, low testing and general hiccups. They didn't release any testing data for one month, between mid-May and mid-June. This created a lag in data by June end, after which they suspended testing for a few days. This is absolutely crazy to do during a pandemic."

“Asymptomatic patients are tested only in super-spread areas. Only when the numbers increase in a particular threshold, do they isolate people and test them. Every single day that you delay the testing, you are allowing the virus to spread,” he says.
Shrinivasan says that this lapse is not being seen in India alone, but elsewhere too. "We need to understand that this is a pandemic and the administrative system is overwhelmed right now. This happened even in New York. I was able to find out about the issue of missing deaths in Mumbai, Chennai and Delhi because at least their systems honour some kind of transparency. But the public should not feel that the information was hidden intentionally. Having said that, administrative incapacity to get all the information and convey it to the public is definitely problematic."
She further points out that in India, only 20 per cent of deaths before the pandemic were medically certified. "Currently, half of the government staff is at home in lockdown. To expect the remaining staff to accurately and timely enter in all the data in the system is unfair. When a person tests positive, the information first goes to the ICMR, which then passes it to the respective state government. Of this information given to the state, more than 50 per cent of the positive cases cannot be traced. This is because basic information like full names and addresses of patients are not taken down correctly. There are counties in the US that are not relying on electronic media, but are taking down all information manually. We really need to start recording all the data more accurately."
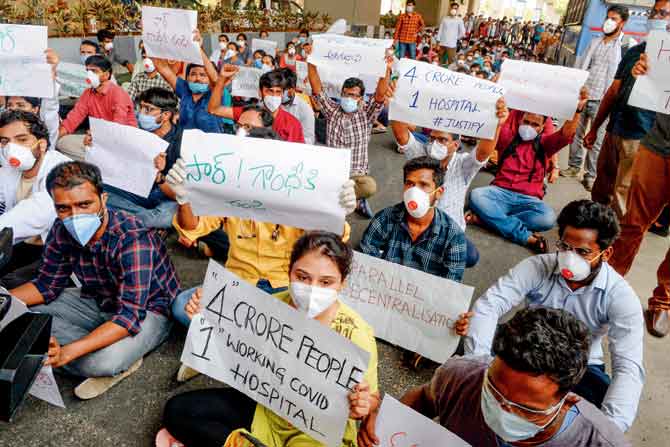
Junior doctors from the Gandhi General Hospital in Hyderabad protest outside the hospital, following an alleged attack on a medical staffer by relations of a deceased patient. Rukmini Shrinivasan says, “Telangana is in the worst shape for terrible transparency of data, low testing and general hiccups.” Pic/ Getty Images
So, does this mean the impact of the disease will never be determined? "Every infectious disease in our country is highly under-counted. We under-report malaria and TB every year. However, India conducted the Million Death Study (MDS) in 2013, where a verbal autopsy was done to determine disease patterns and direct public health policy. So, we do have the resources to do the same to determine the impact of COVID-19 in India. Eventually, we will find out how it happened. But it will take time."
This is where websites like covid19india.org have been instrumental. Functioning like a crowd-sourced model, the website doesn't rely on one single site or platform for information. After the first few members of the team published the initial version of the website, volunteers were invited to join their Telegram group, if they wished to help. "Initially, the members searched through Twitter for the latest updates from administrations and posted them in the group. Few of the volunteers signed up to update this information in the Google Sheet after verifying the content. Some wanted to help improve the site. Some helped out in collecting information regarding all essential services. Within a couple of weeks, the group grew rapidly and then it was split into multiple functions and initiatives."
In the succeeding months, the team added several automation tools and Telegram bots to automate the manual work as much as possible. "By then, we sort of knew the format in which each state published the data. Eighty per cent of the data fetch, transformation, comparison and initial verification is done by bots. Final verification is done by a volunteer and then added to the sheet."
Discrepancies are avoided by making sure that the district-wise and state-wise totals that they update are in line with the source that they got. "Nonetheless, we do make a few errors, while adding the data or while interpreting the state bulletins. With a large number of visitors on the website from every state in India, it gets reported through our contact form or on Twitter. We proactively look into such notifications and investigate them right away to fix the numbers."
While tracking the pandemic has been a tough exercise, what is even more challenging is making it presentable. "Our analytics show that 96 per cent of all traffic to our website comes from mobile devices. This means that the site has to be mobile-friendly and easy on data usage. To enable this, we were mindful about making the data representations simple in the back-end and made the site minimal enough for mobile users not to face issues."
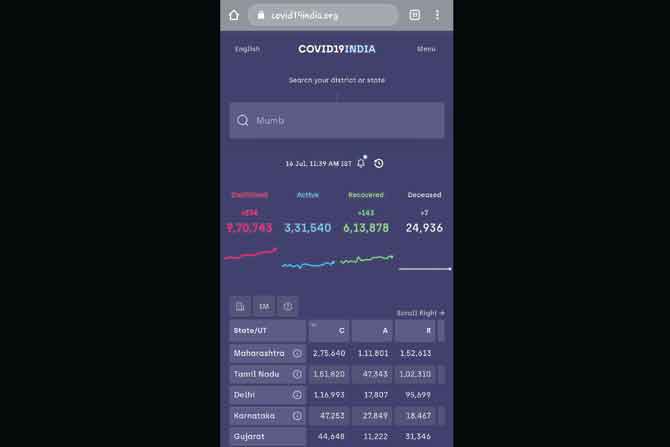
The volunteer-driven website, covid19india.org, presents a “tracker” based on that database of up-to-date numbers, entered by its members
The data-crunchers and analysts, however, have no good news for India, as yet. "Infection is still in an alarming phase even after multiple lockdowns and containments. Although we are in no position to make any opinions on administrations, the ground reality is much harsher than designing websites. We like to be pragmatic and hope that everyone is working in good faith to get us past this pandemic," said a member of the covid19india.org team.
Shrinivasan is more alarmist. She feels India might soon secure the position of the second-worst hit nation in the world, if things don't improve. "In the last few days, we are adding more per-day cases than Brazil. If this continues, we might beat it to become the second most hit country in the world."
Her sentiments are shared by Wilson, who predicted that India would hit 10 lakh cases on July 16. "…unless Govt decides to postpone reporting of a couple of thousand cases to next day! India's #COVID19 trajectory is no mood of slowing down!" he tweeted on July 16. "Normally, I only predict for three weeks and not more, because, it takes at least two weeks for the virus to spread. But I don't see the cases flattening anytime soon, at least not until we have a vaccine. My worry is that when these numbers increase, our health system will show signs of fatigue and slowly start cracking."
Catch up on all the latest Mumbai news, crime news, current affairs, and a complete guide from food to things to do and events across Mumbai. Also download the new mid-day Android and iOS apps to get latest updates.
Mid-Day is now on Telegram. Click here to join our channel (@middayinfomedialtd) and stay updated with the latest news
 Subscribe today by clicking the link and stay updated with the latest news!" Click here!