


Vishal B Malkan advocates "Go Deep, Not Broad" for trading. Master RSI to gauge market momentum. Learn sustainable investing!

Vishal Malkan
"Go Deep, Not Broad" – The Philosophy That Transformed Thousands"
"Trading/ investing is not a one-day match; it's a lifelong learning journey. We want to understand and survive in the market rather than chase quick wins. If we stay focused on learning for 3–4 years, market understanding develops naturally."
Vishal B Malkan’s educational approach emphasises mastering one tool deeply rather than trying to learn many superficially. His RSI framework offers practical clarity for traders and investors looking for sustainable, long-term learning in the financial markets.
What is Market Momentum?
One of the biggest challenges for both new and experienced traders is identifying the direction and momentum of the market. In a world overloaded with technical indicators, simplicity often brings better clarity. And one of the simplest and most effective tools to measure momentum is the Relative Strength Index (RSI).
After over 30 years in the markets, Vishal B Malkan has realised that simplicity wins over complexity. His personal journey-from confusion with dozens of indicators to mastering RSI-provides insightful education to those seeking a better understanding of market movement.
“The other word for momentum is speed,” explains Malkan. “Just like a car’s speedometer shows how fast we’re going-120 kmph is fast, 20 kmph is slow-RSI shows how fast the market is moving.”
This powerful analogy helps demystify technical analysis for many aspiring traders. Malkan learned from his mentors that less is more, and that going deep into one reliable indicator like RSI can offer more meaningful results than juggling many at once.
RSI: The Market’s Speedometer
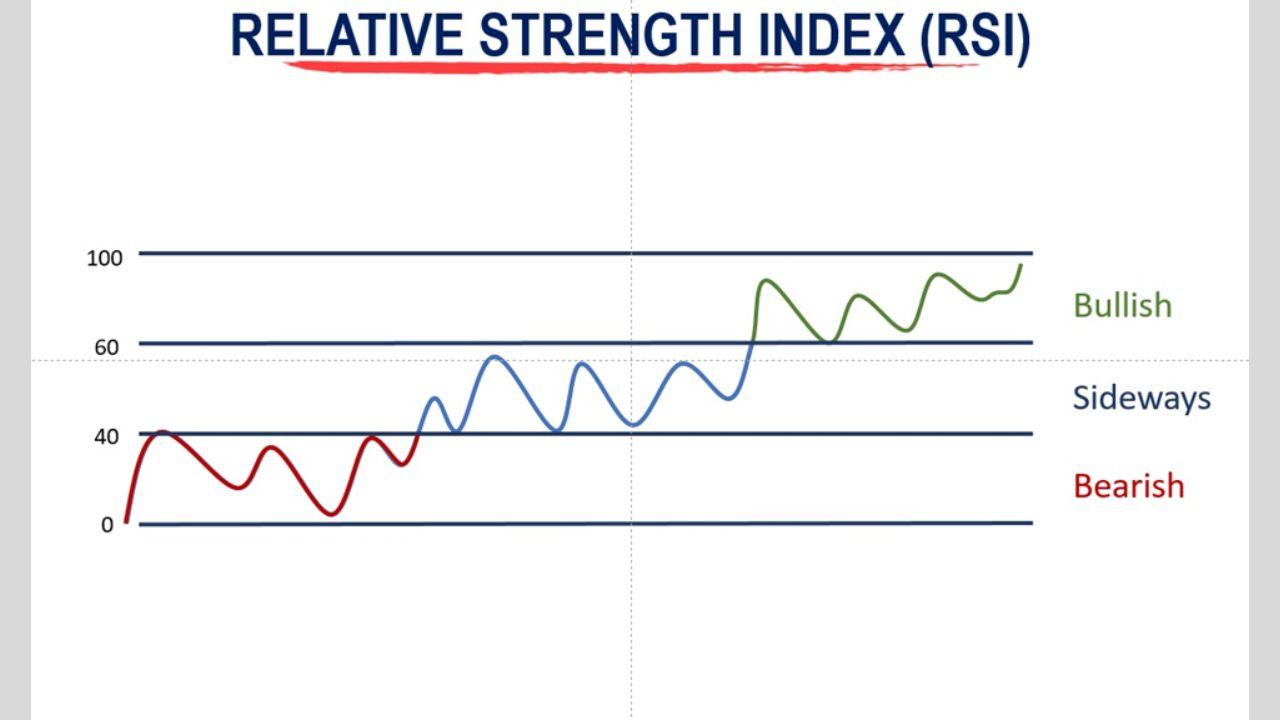
Malkan breaks down the RSI's 0–100 scale into three simple zones to make it easy for anyone to understand:
- Below 40 – Downtrend
Indicates bearish sentiment. Market may be losing strength or declining. - 40–60 – Sideways Market
Suggests indecision, consolidation, or a choppy market where there's no clear trend. - Above 60 – Uptrend
Indicates bullish momentum and potential upward movement in prices.
These ranges are not predictions but educational zones designed to help traders read the current market environment with more clarity and objectivity.
“When the trend catches, money happens,” Malkan often reminds his students. But first, understanding the trend is the key-and RSI is a great tool to do just that.
Visual Explanation: Chart Analysis
The above 3 RSI zones-below 40, between 40–60, and above 60-can be easily identified on charts.
Below is an example that visually represents how these zones play out in a real market scenario.

This simple view helps learners spot whether the market is gaining strength, moving sideways, or losing momentum.
To learn more and see this concept explained in detail (in Gujarati), watch the dedicated video by Vishal B Malkan on his Gujarati YouTube channel:
https://www.youtube.com/@malkansview5305
_e.jpg)
 Subscribe today by clicking the link and stay updated with the latest news!" Click here!